Measurement
Part of What social media agencies measurement means for buying and reporting
How to structure a social media agency reporting dashboard
A practical guide to a social media agency reporting dashboard: its three layers, metric definitions, platform sources, tools and consent records.
What to take away
A social media agency's reporting dashboard is one recurring view that joins platform metrics and campaign spend to the client outcomes already tracked in their own systems.
- Build the view around the questions clients ask in review meetings, not around whatever the platforms export most easily.
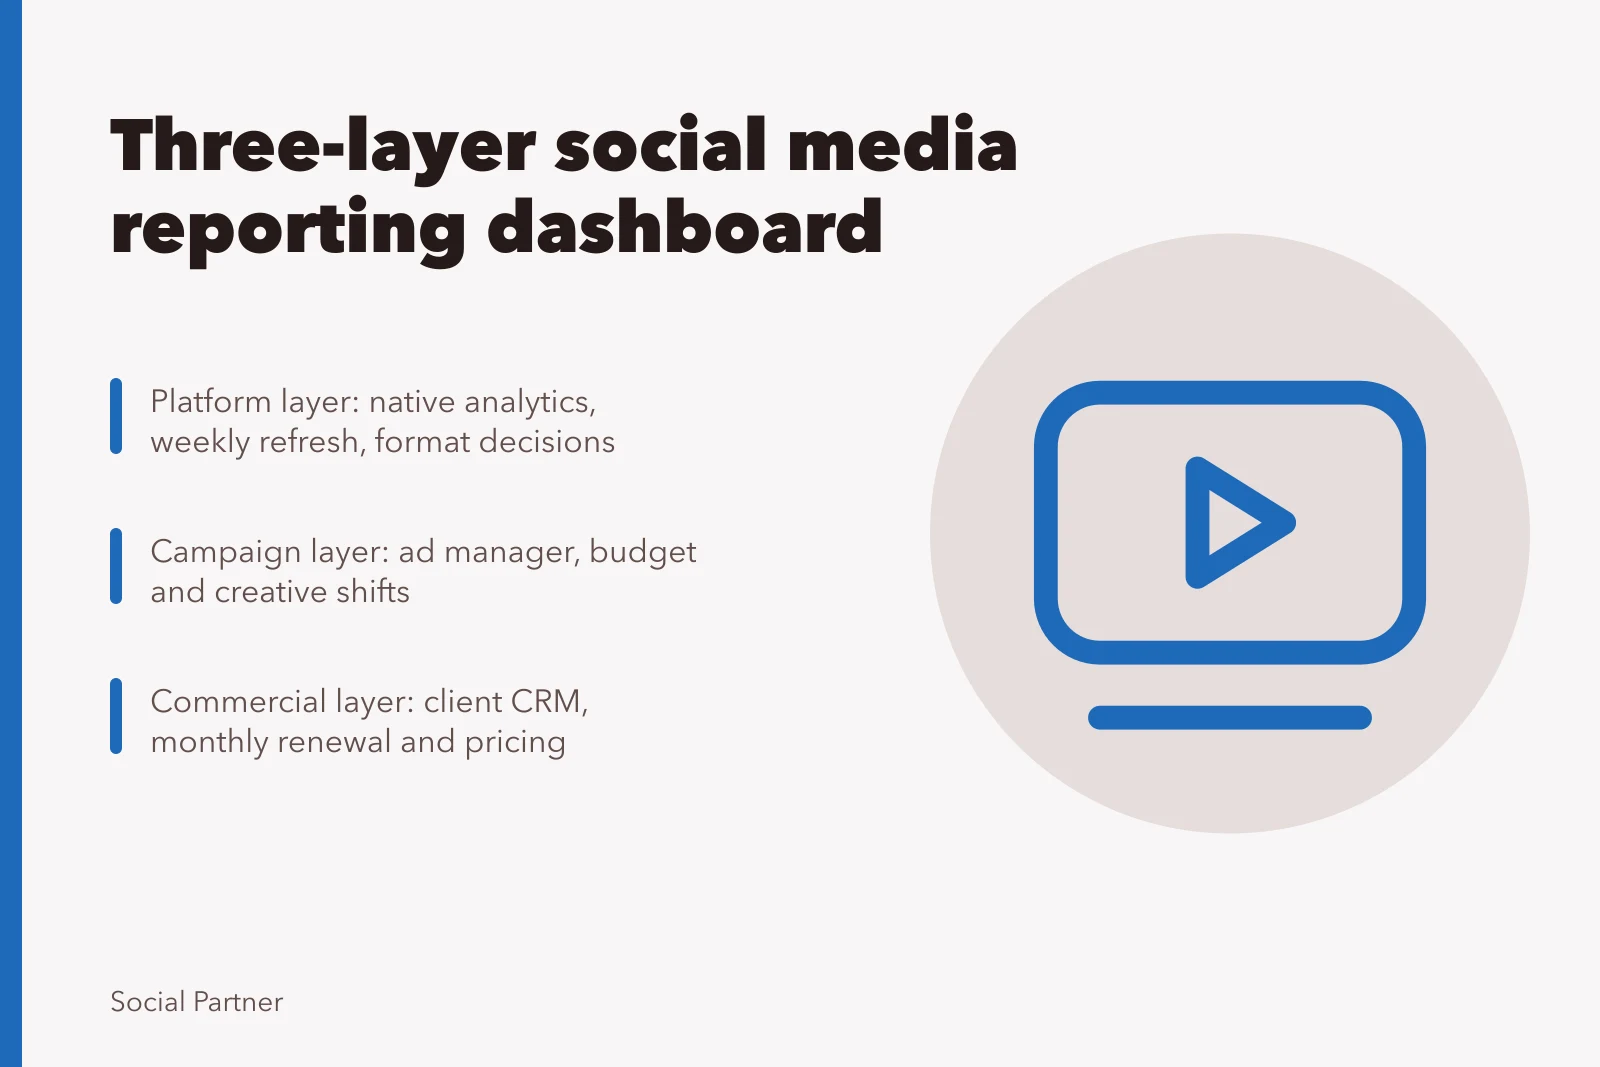
- Keep three layersplatform performance, campaign delivery, and the commercial outcomes the client already tracks.
- Fix denominators and naming before build, so month-on-month comparisons survive a platform update.
- Name an owner for every metric and state how often it refreshes.
- Keep consent and cookie evidence beside the dashboard, not in a separate folder.
Plan the dashboard around client decisions
Agencies often start from the export menu. The client then receives a wall of columns nobody opens. Begin with the decisions instead: where to move budget, which format to repeat, whether the retainer continues.
Map metrics to decisions
- Where to move budget
- Which format to repeat
- Whether retainer continues
- Leave out metrics no decision uses
- Keep full export in appendix
Map each metric to a decision
Give each row a decision, the metric that informs it, and the system it comes from. If nothing in the review depends on a metric, leave it out of the default view. Keep a full export in an appendix for anyone who wants it.
Agree denominators and naming
Standardise each metric before comparing clients: reach is the unique people or accounts exposed, according to the platform; impressions are total displays, including repeat displays; and accounts engaged are distinct accounts that interacted. Engagement rate is interactions divided by the agreed denominator, such as reach or impressions; frequency is impressions per reached person or account. In GA4, an engaged session exceeds its engagement-time threshold, includes a key event or has multiple page or screen views.
For paid reporting, define CPM as spend per thousand impressions, CPC as spend per click, CTR as clicks divided by impressions, CPL as spend per lead (or qualified lead when that is the agreed outcome), CPA as spend per agreed acquisition, and ROAS as attributed revenue divided by ad spend. Record the definition, denominator and date for each metric; the social media agencies key metrics in England article can be a further reference.
Build the dashboard in three layers
Each layer answers a different question, and mixing them is what makes dashboards unreadable. Keep them on separate tabs and link the summary to both.
Three dashboard layers
Platform
- Source
- Native analytics
- Decision
- Format mix
- Refresh
- Weekly
Campaign
- Source
- Ad manager
- Decision
- Budget shifts
- Refresh
- Weekly or monthly
Commercial
- Source
- Client CRM
- Decision
- Renewal
- Refresh
- Monthly
| Layer | Typical source | Decision it serves | Refresh |
|---|---|---|---|
| Platform | Native analytics | Format and posting mix | Weekly |
| Campaign | Ad manager or agency tool | Budget and creative shifts | Weekly or monthly |
| Commercial | Client CRM or finance system | Renewal, scope and pricing | Monthly |
Platform and campaign layers
Platform data is free but inconsistent. Campaign data costs money and needs a consistent naming convention across accounts, or the totals will not reconcile. Without that convention, two people can report different totals from the same account. Agree the labels with the client before the first report.
On the platform tab, report reach, impressions, accounts engaged, engagement rate and frequency where available. Name the source: Meta Business Suite and Meta Ads Manager for Facebook and Instagram; TikTok's native analytics and TikTok Ads Manager; LinkedIn Page analytics and Campaign Manager; X's native analytics and Ads Manager; and YouTube Studio for organic video or Google Ads for paid YouTube. On the campaign tab, show spend, CPM, CPC and CTR from the relevant ad manager, then use site and outcome data to report CPL, CPA and ROAS against the agreed attribution window.
Reporting products to assess include Looker Studio, AgencyAnalytics, DashThis, Whatagraph and Metricool. Connect supported accounts through a product's direct integrations or use a connector such as Supermetrics to bring data into Looker Studio; GA4 supplies website session and event data, while the client's CRM and finance records supply lead and revenue outcomes. Check connector coverage, permissions, attribution settings and refresh options before choosing, as availability varies by product and account.
Commercial layer
This layer is the one clients trust most, because the numbers come from their own systems. Ask finance or sales to supply a single outcome figure, such as qualified leads or revenue. A team paying £2,500 a month, for example, wants cost per qualified lead rather than cost per click. State whether the outcome comes from the client's CRM, sales records or finance system, and agree how a qualified lead or attributed revenue is counted.
Keep the dashboard defensible
Consent, cookies and audience claims
The Privacy and Electronic Communications Regulations 2003 (PECR) govern cookies and similar technologies; consent is generally required for non-essential storage or access. UK GDPR applies when personal data is processed. ICO guidance on cookies and storage explains the consent requirements, so record the consent basis and evidence alongside the dashboard when it depends on pixels, tags or logged-in audience data.
Advertising claims in reporting
Paid posts sit inside the advertising codes, including the CAP Code, so a dashboard that reports reach should also show that ads were identifiable as ads. The ASA and CAP explanation of advertising regulation sets out the scope of those rules.
Documenting how numbers were produced
Record the date range, attribution window and any filter applied, then keep that note with the report. Fix the window and success metric before testing creative and audience variations; this makes the test easier to defend.
For a LinkedIn campaign experiment, record the audience, creative, date range, attribution window and primary outcome before launch. Compare like with like and note delivery differences; a reader who cannot see the method will assume the number was chosen for effect.
A dashboard is only as strong as the reporting cycle behind it. The social media agencies measurement and reporting guide sets out how monthly totals become a review process clients sign off.
Common questions
Who should own the dashboard?
The agency usually builds it, but the client should own the outcome figure. Agree that split in the contract so neither side can quietly change a definition.
How often should numbers refresh?
Match the refresh to the decision. Budget shifts need weekly data; renewal conversations do not. Monthly packs built from weekly pulls avoid last-minute scrambling.
What should the dashboard leave out?
Anything no one acts on. Vanity totals such as cumulative impressions or follower counts rarely change a decision, and they take space away from cost per outcome.
Do clients need raw exports?
Offer them, but do not lead with them. A raw export without definitions and date ranges invites arguments about the wrong question.